
Management Data Warehouse Reporting
Management Data Warehouse (MDW) allows you to collect data about your server and view it in a readable format. MDW is a relational database that contains the data that is collected from a server that is a data collection target.
MDW provides 3 reports, and other custom reports can be created. The reports will provide suggestions for improving performance based on information gathered by the Data Collector. The 3 main reports are Server Activity History, Query Statistics History and System Disk Usage.
Using a basic configuration of the MDW enables a DBA to perform tasks such as:
- Proactive Tuning
- Historical Query Analysis
- Performance Baselining
- Database Growth Forecasting
- Storage Planning
MDW helps answer the following questions:
- What are my most expensive queries in terms of a given resource measure (CPU/Duration/IO)?
- What is my SQL Server instance waiting on typically?
- Which are my fastest growing databases?
- Why is query X blocking?
- Is SQL Server busier than normal for this time of day?
This article contains information on the following:
Configure Management Data Warehouse
To configure MDW, perform the following steps:
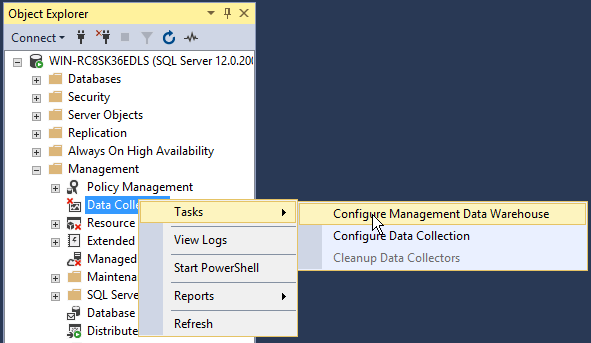
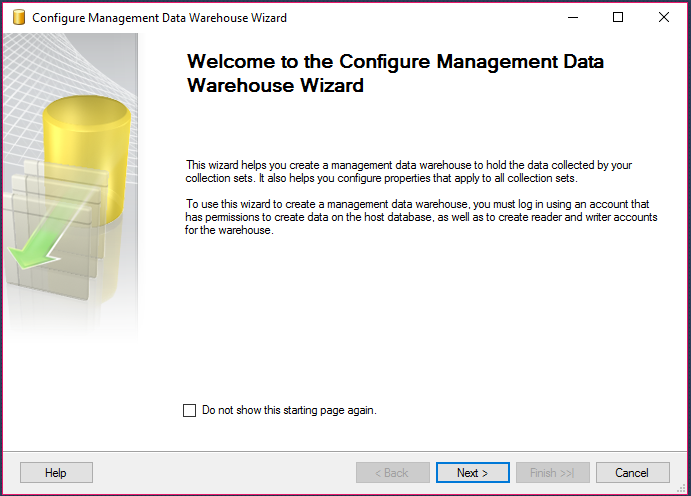
- Expand the Management node in Object Explorer and right click on Data Collection and select Configure Management Data Warehouse. This will open up a wizard.
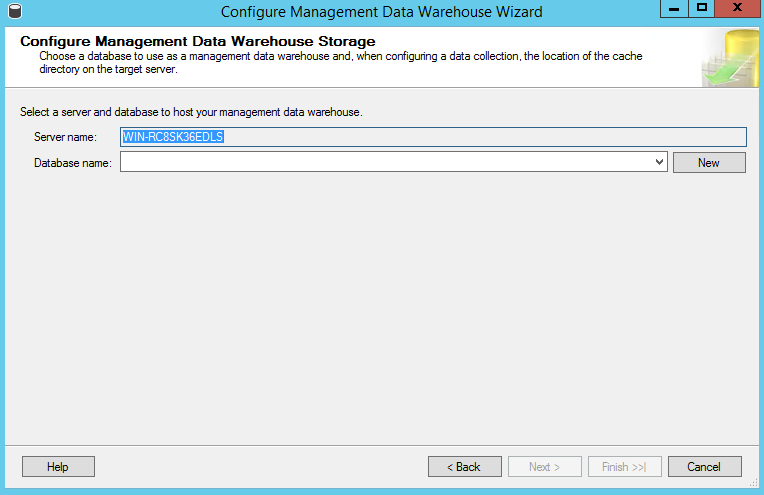
- Type in a Server Name, by default the server you are currently on will be populated in the name. You are able to set up MDW on a separate server and do the data collection for another server.

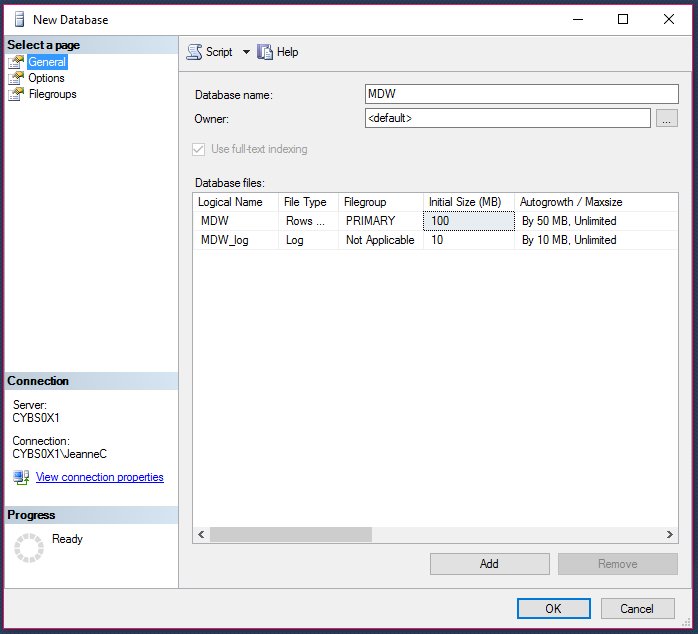
- Click New, next to Database Name. A pop-up will appear to create a database for the MDW to collect and write the data to. Type in Database Name and click ok.
- The Database Name will now be populated and you can click on next.
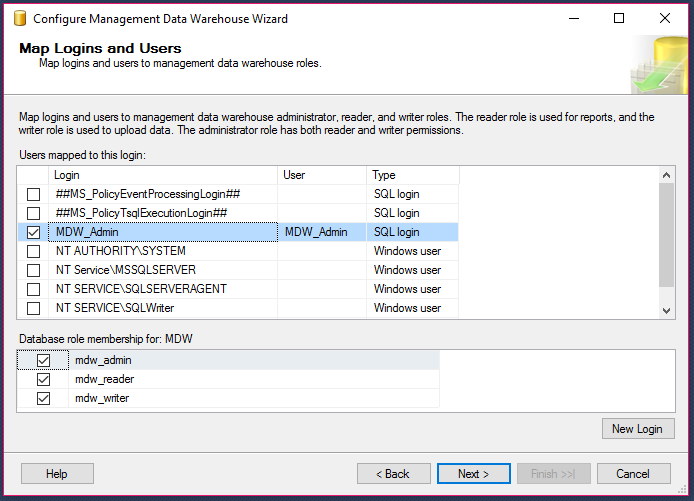
- Select a user to map to the MDW and set the Database membership role and click Next.
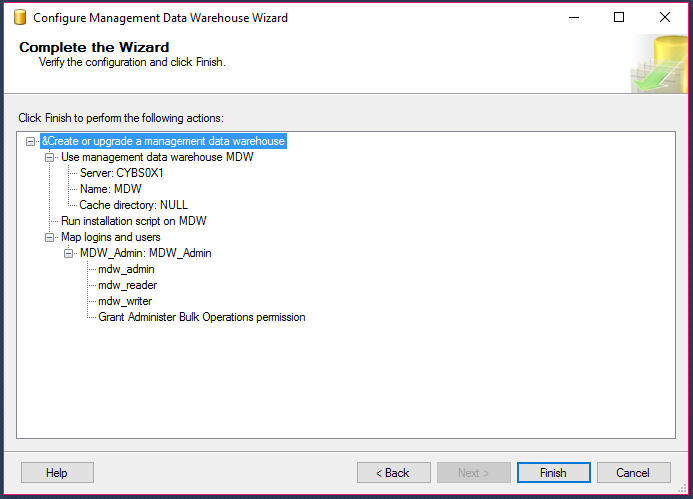
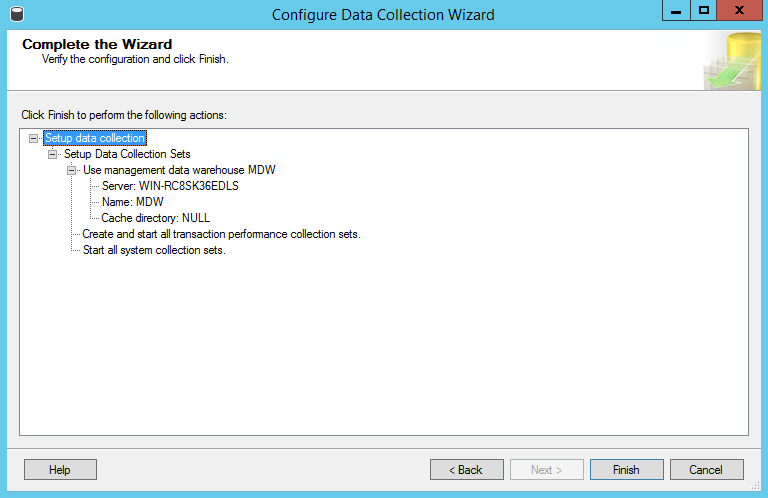
- A summary window for the configuration will display, and you can click Finish.

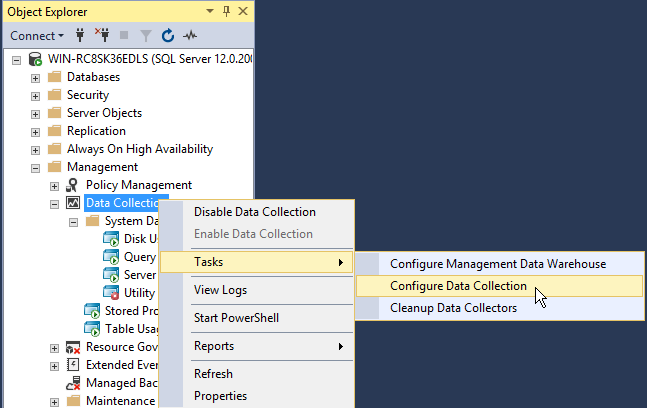
- Next, we need to set up a data collection to collect data from the server and databases you are interested in getting information from. Right click on the Data Collection node again and select Configure Data Collection.
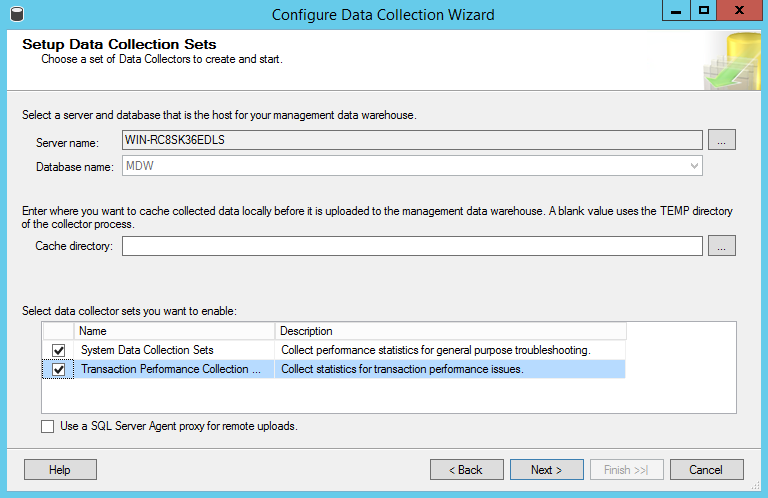
- Select the Server and Database where you want to store the data and click Next.
- A summary screen will display. Click Finish. Make sure SQL Server Agent is running, otherwise the setup will fail.
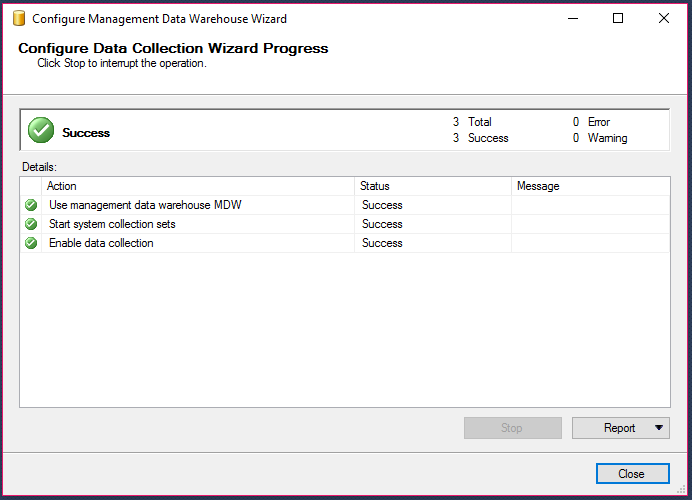
Once complete you will see the Data Collection sets in the Object Explorer.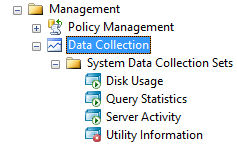
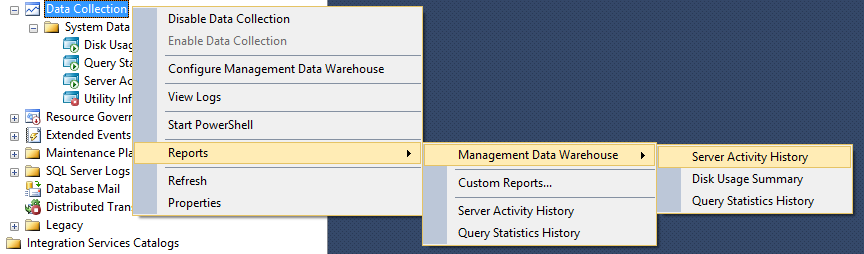
To access the reports:
- Right-click the Data Collection node.
- Select Reports > Management Data Warehouse.
Predefined data collection sets
Disk Usage
The Disk Usage data collection set collects information about disk space used by both data and log files for all databases on the SQL Server instance, growth trends, and average day growth.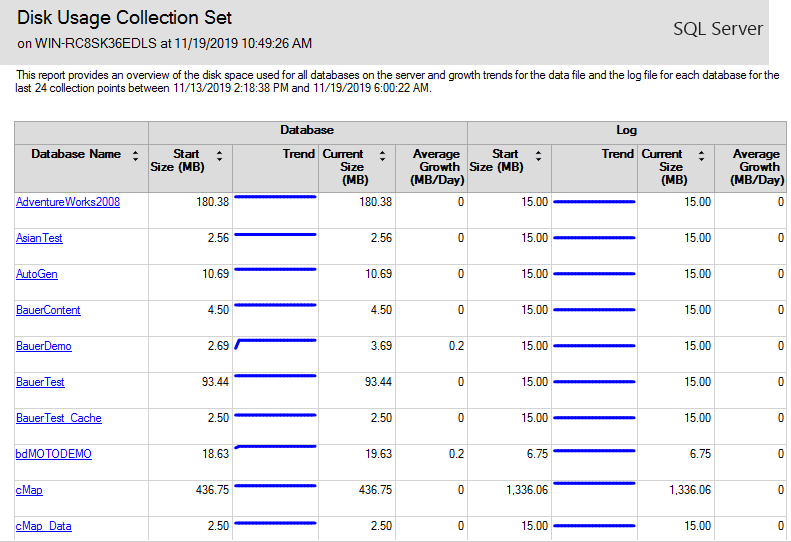
By default, the Disk Usage data collection set collects data every 60 seconds and uploads data into the MDW database every 6 hours in non-cached mode.
In non-cached mode, collection and upload are on the same schedule. The packages start, collect, and upload data at their configured frequency, and run until they are finished. There is only one job created for collection sets in non-cached mode. Non-cached mode allows for the collection and uploading of data to occur on demand, as well as at the intervals specified in the job.
Click on any database name to graphically show the disk space allocation for any database, both for the database files and the logs.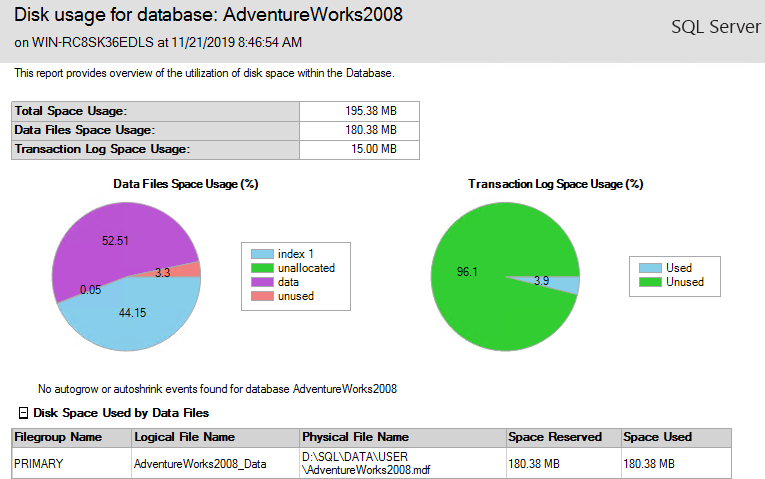
If a trend line is clicked instead, you can see how the allocated space changed over time, making it easy to see any significant changes and detect any growth behaviour that could cause issues. If disk space has a particular restriction on the server that would cause issues due to lack of disk space, this data collector set would provide an insight on which database(s) in particular is growing to cause them.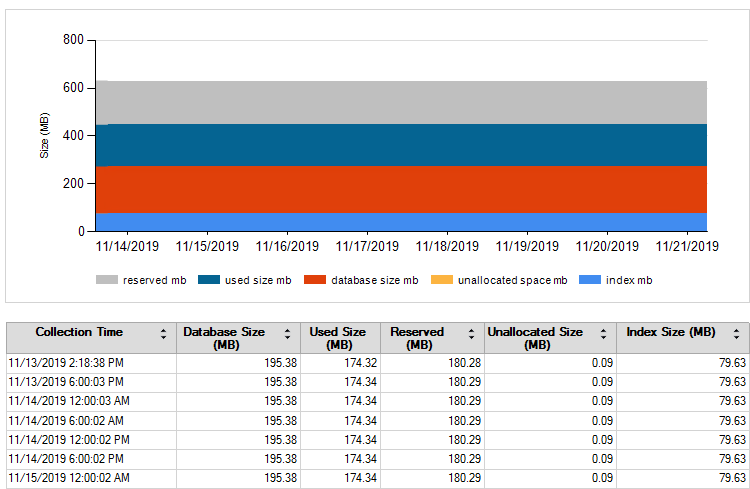
Query Statistics
The Query Statistics data collection set collects information about query statistics, activity, execution plans and text on the SQL Server instance. It does not store all executed statements, only 10 worst performing ones.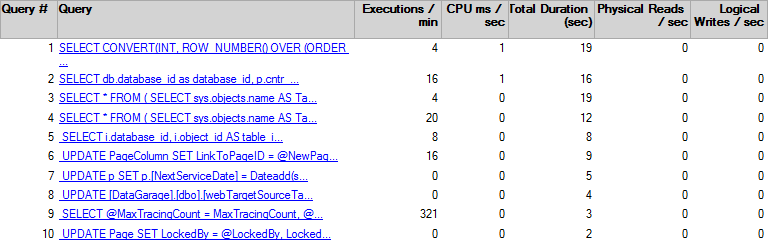
The Query Statistics data collection set uploads the collected data in the cached mode
In cached mode, the data collection and uploading of jobs are on different schedules, so two jobs are created for each collection set. Cached mode supports continuous collection of data, but less frequent uploads. For example, the default Server Activity collection set uploads data by default every 15 minutes. However, the collection items are collected every 60 seconds.
In cached mode, one SQL Server job is executed every 60 seconds to collect the data. This data is stored (cached) into a local cache folder. Another job is run every 15 minutes to read the cached data and insert it into the MDW database.
The cached mode creates less overhead than non-cached.
It’s possible to navigate through 4-hour intervals to visualize the server activity at different times by using the controls below the time scale. The list of queries and the activity graph can also be filtered by CPU, query duration, disk I/O, Physical Reads and Logical Writes. This allows troubleshooting particular issues. If the issue is that a query takes too long to execute, for example, then clicking on “Duration” will sort the queries and the activity graph by duration, and only the queries that take the longest to execute will be displayed.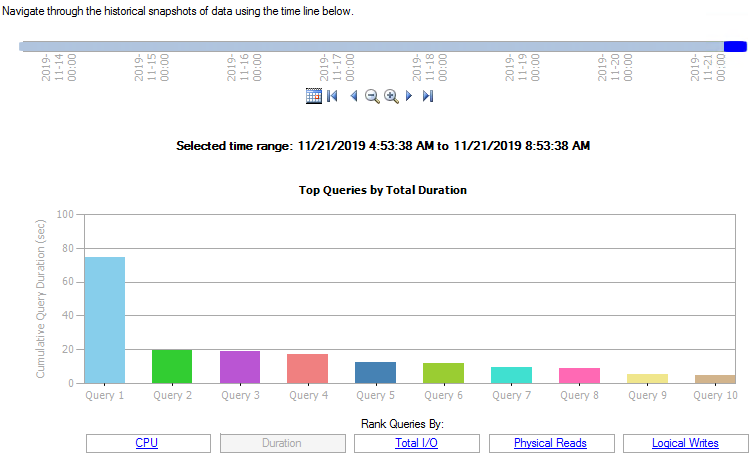
Clicking on any query on the list will bring up additional details based on the filter selected. On the example below, since Duration was selected, data about the query’s duration is displayed. If any other filter is selected the data and graph will adjust accordingly.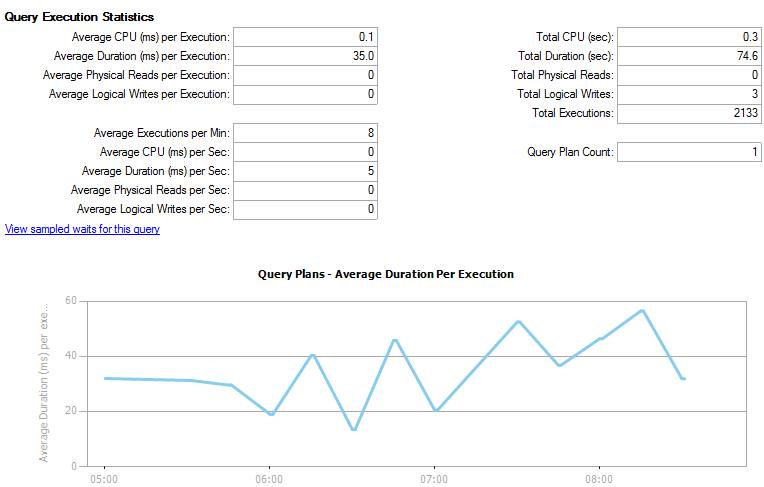
This information usually leads to analyzing a query’s execution plan in order to optimize it to reduce the most critical metric (the one being filtered)
Server Activity
The Server Activity collection set collects information about resource usage (CPU, memory, disk I/O, and network), SQL Server waits, instance activity (batch requests, logouts, SQL compilations and recompilations, transactions, user connections, and logins), and operating system activity. Data is collected every 60 seconds and uploaded in cached mode every 15 minutes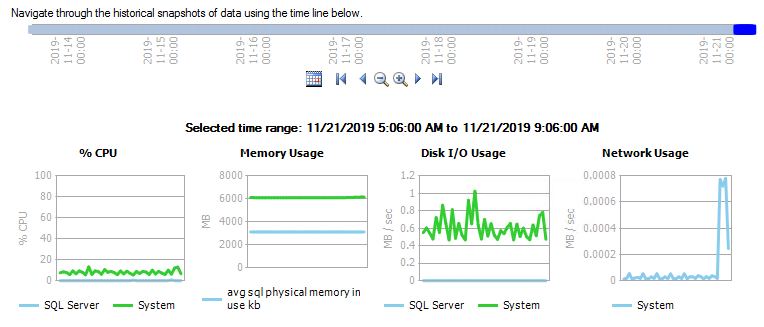
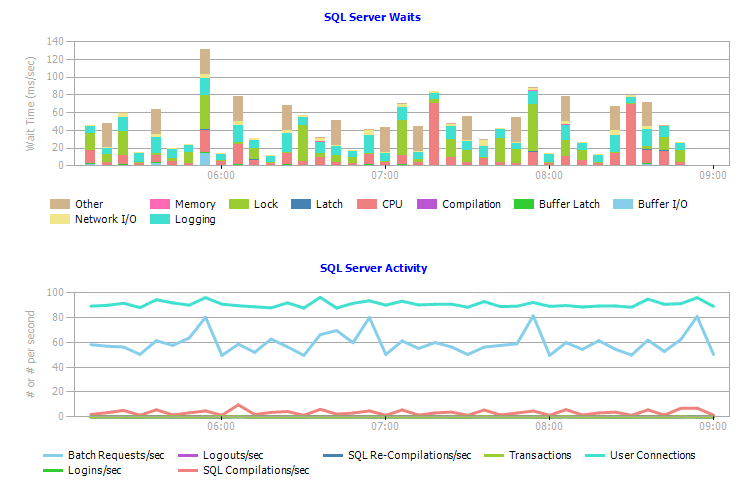
If any of the first four graphs is clicked (% CPU, Memory Usage, Disk Usage or Network Usage), a more detailed graph will be shown, as well as a table that displays how each process is using the selected resource. On the example below, the CPU percentage by process is shown.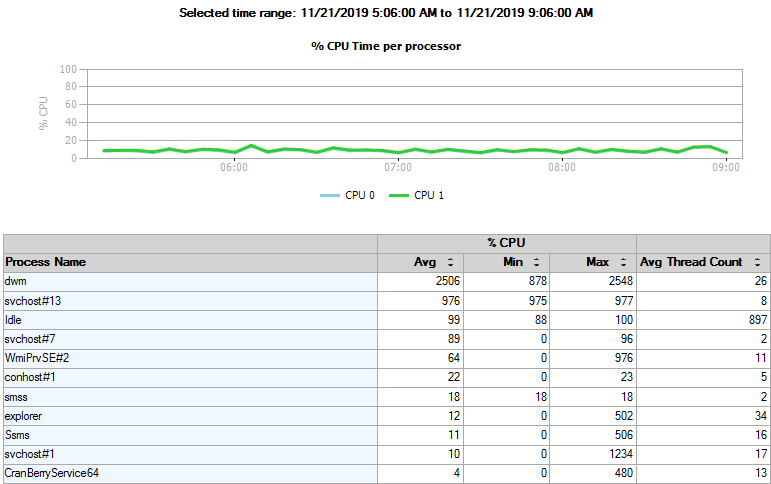
Each graph can be useful to know where to start troubleshooting whenever issues related to system resources arise, such as thread abandonment or out-of-memory issues.
If you require further assistance configuring the Management Data Warehouse or accessing its reports, contact our support team.