
Introduction
Starting with the the DSP® 6.6.1 release, dspMonitor now includes:
- Data quality thresholds - The ability to specify different scoring thresholds which are then used to drive the status coloring of the reports, Green above the Warning threshold, Amber between the Warning and Critical thresholds and Red when the score is below the Critical threshold.
- Opportunity / defect modeling - Error reports can now be assigned an Opportunity view so that the total number of records can be compared to the failed record set and thus a quality score calculated against the defined thresholds.
- Improved reporting and dashboarding - New dashboards have been added providing increased visibility into the overall, group, object and application level data quality scores as well as the ability to drill down to the individual reports.
This article focuses on how to use this new functionality when registering new reports (new deployment), or updating existing reports (upgrade). The upgrade to 6.6.1 or later version can be performed over existing dspMonitor content but the additional functionality stated above will require modifications to the existing reports.
This article contains these sections:
- Configuring the New Functionality
- Opportunities and Failures
- Registering a New Report
- Updating an Existing Report
- Upgraded Dashboards and Charts
Audience
It is assumed that the audience for this document is able to use dspMonitor to configure Reports, assign to Objects and Targets and publish to Groups.
Configuring the New Functionality
Prior to using the new functionality there are a number of configuration steps that need to be performed.
Review Quality Dimensions
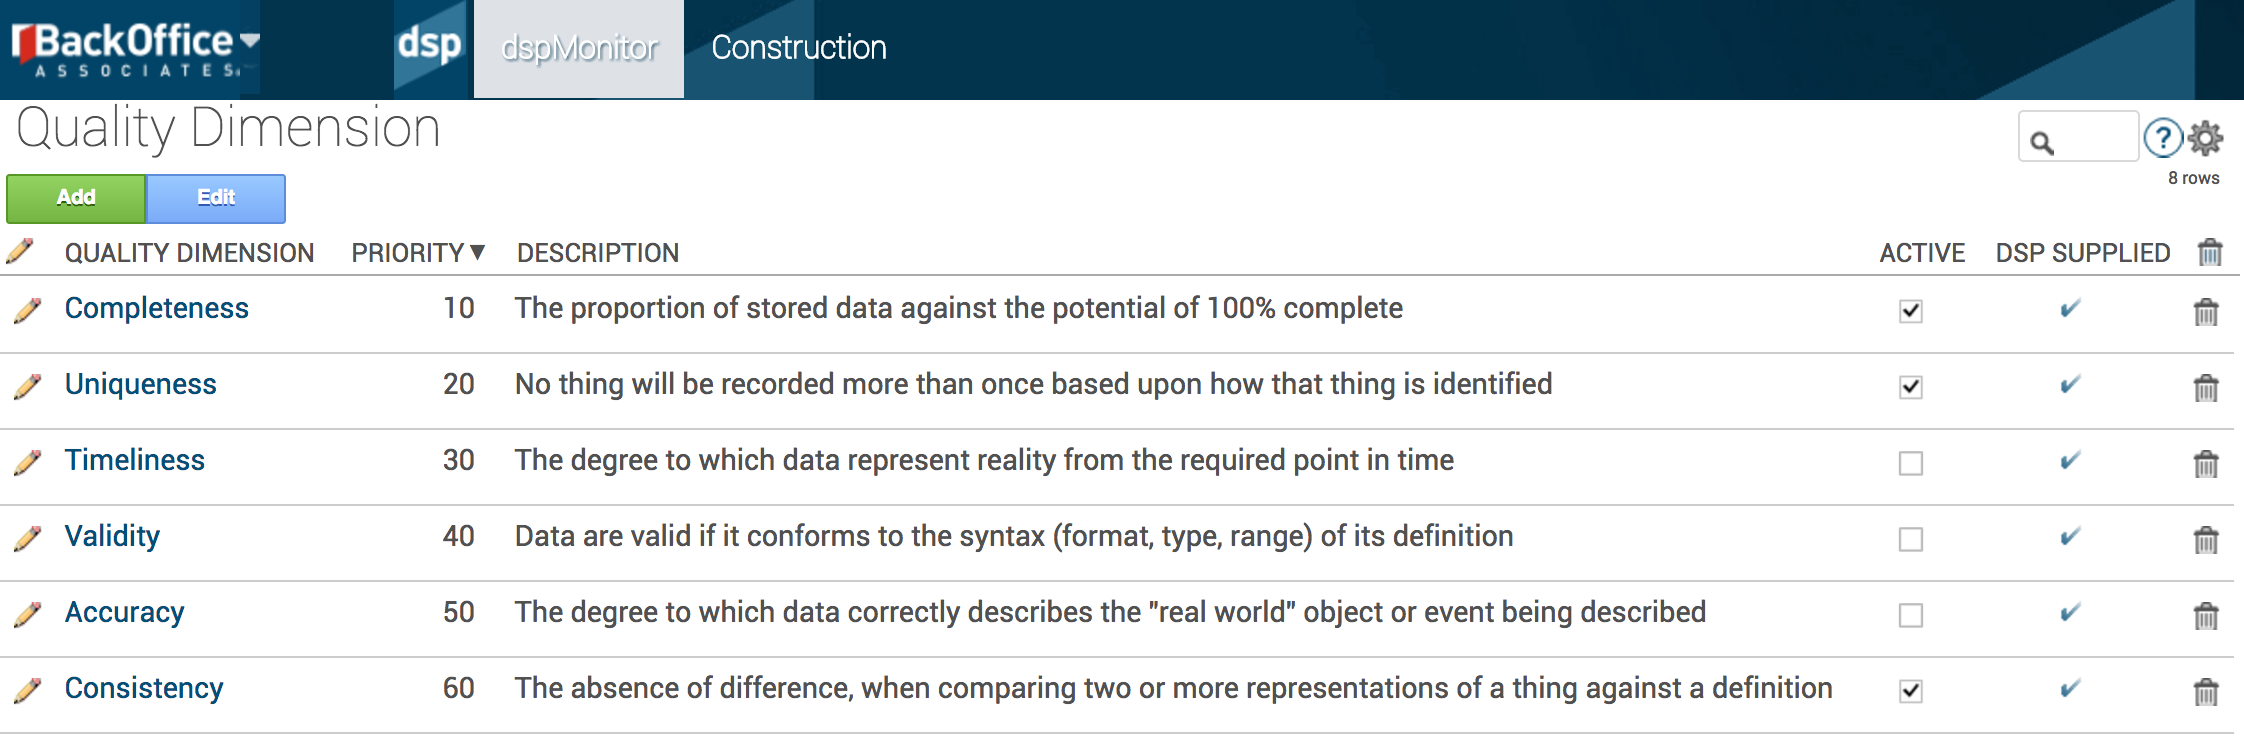
Screenshot 1: Configuration - Quality Dimension
If additional dimensions are required then these can be added within the configuration area of the dspMonitor solution.
Review Data Quality Score Thresholds
Data Quality Score Thresholds provide a way of visualising the status of the data quality reports based on the percentage of errors vs the number of total opportunities. Each thresholds is set with a warning and critical threshold setting. Reports with an error percentage below the high warning threshold display a green status icon, reports with an error percentage between the warning and critical thresholds display a yellow status icon, and those reports with a percentage failure rate above the critical threshold display a red status icon.
The person deploying the solution can choose to use Sigma level thresholds that are configured with the values associated with SixSigma scoring, or can choose to set their own numeric threshold values. To switch between the two options the user will check / uncheck the Enable Sigma Level checkbox on the Configuration / Parameters page (Metric Parameters tab).
If Sigma Level thresholds are used (the default setting), then the person configuring the data quality score thresholds can add new thresholds and select the sigma levels associated to the critical and warning threshold settings. If the Sigma Levels thresholds are not used, then thresholds can be configured with only the numerical percentages specified.
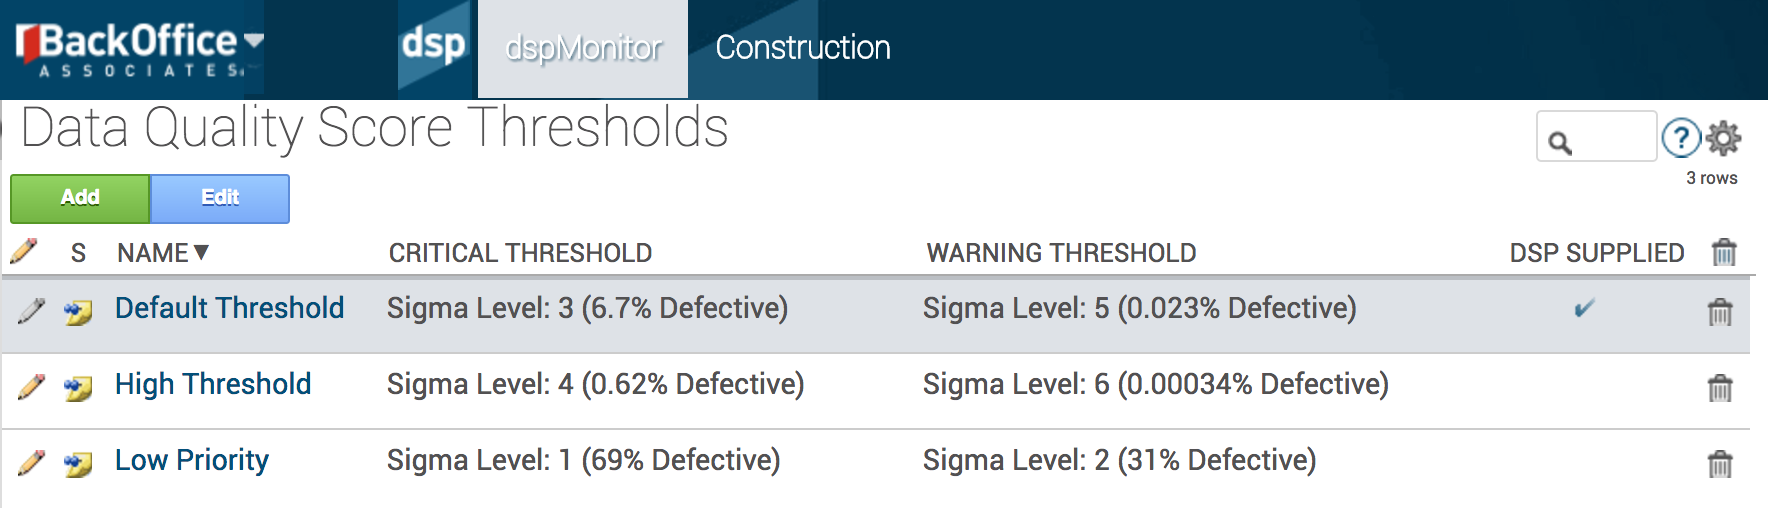
Screenshot 2: Configuration - Data Quality Score Thresholds
On the Configuration / Parameters page (Metric Parameters tab), select the default threshold ID you want to use when no individual threshold is set.
Review Your Objects and Groups
Objects and Groups provide ways of categorizing reports. Reports are associated to one or more Objects and then an Object is published to one or more Groups. The Object is used to assign the report to a specific data object (for example, Customer, Material, Account, Contacts, etc) depending on how the business represents its data objects. Groups are used to associate reports into a way that the business will relate to the reports, i.e. Finance, HCM, Sales and Distribution, etc. Once a Group is created, reports can be assigned individually to the group or an entire Object can be published to the Group, thus assigning all of the reports associated to the Object.
Opportunities and Failures
In this release of dspMonitor, a new concept to allow data quality scoring to be applied to error reports has been introduced. The creation and assignment of opportunity views allows for the number of assessed records to be compared to the number of failed records. Opportunity views can only be assigned to Error reports, not to Info or Metric reports. With the assignment of Opportunity views the calculations regarding Data Quality Scoring Thresholds (percentage of failures compared to opportunities) and the DPMO (Defects Per Million Opportunities) can be calculated. These calculations form the basis of the dashboards and charts within dspMonitor.
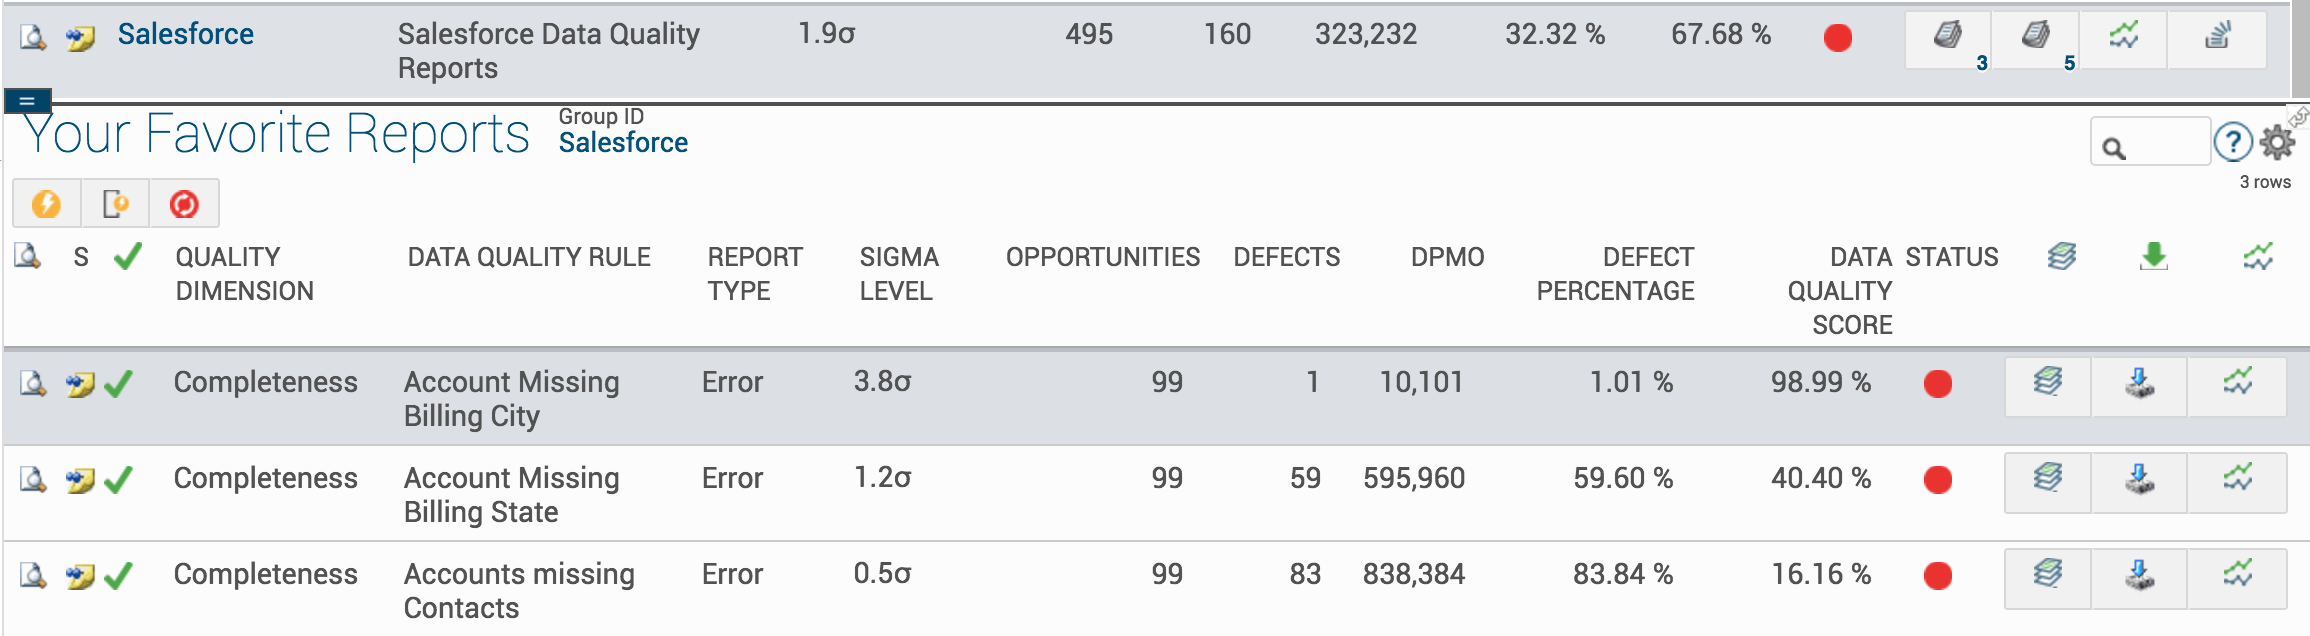
Screenshot 3: Your Groups - Your Group Reports
Registering a New Report
Before registering a new report, as a best practice , ensure you have:
- Registered your Data Source in Common - Configuration - Data Source Registry where your reports will reside.
- Configured your Thresholds and Quality Dimensions.
- Created an Opportunity View that contains the rows for all the records being assessed in the report, and includes the columns for the key fields and for any user filters that could be applied. i.e., total opportunities and named it using the convention tv*OptSel (e.g. tvAccount_AllRecords_OptSel).
Note: For further information on the creation of Opportunity Views see (Opportunity Views Best Practices section below). - Created the report view that contains only the columns and rows for the failed data set using the naming convention
tv*RptSel
(e.g. tvAccount_AccountsMissingContacts_RptSel) - Created your Objects and Groups appropriate for categorizing the reports you are creating.
Once these prerequisites are met, register the report following these steps:
- Navigate to Configuration - Report Repositories.
- Click the Add button if the required Data Source is not in the available Repository list and select it from the available Data Sources.
- Click the Reports button on the Data Source entry.
- Click the Add button to add a new report.
- Enter the following information into the vertical view of the Repository Reports screen:
Report = <Report view you have created above>
Report Type = Error, Info or Metric (we assume Error for this example)
Implication = <Specify the implication of the failures to the business>
Comment = <Specify additional comments to assist data steward>
Opportunity View = <Opportunity view you created above>
Title = <Specify the report title to be displayed>
Quality Dimension = <Select the appropriate quality dimension>
Status = <Approved> or <Not Approved> depending on required status
Allow Manual Run = <Choose whether report can be manually executed>
Threshold ID = <Select threshold appropriate to the report>
For the other settings refer to the product documentation. - Click Save.
- Close the vertical view.
- Repeat steps 4 through 7 for any other reports you want to register against the specified Report Repository.
- For each added report, click the respective Objects button and choose the Object to relate the report to.
Note: You can add multiple Objects if required. - Once you have added the reports you need and assigned the reports to the Objects you are then ready to publish the Object to the Groups.
- Navigate to Configuration - Objects, select the Object you want to publish and click the Publish button.
- Click the Edit button and choose the Group you want to publish to in the Group ID drop down list.
- Click the Execute button to publish the object to the Group.
Note: If you want to associate individual reports to a Group then you can navigate to the Configuration - Groups page and click the Group Report button and click Add to add individual reports.
Updating an Existing Report
Before upgrading an existing report from a previous version of dspMonitor, ensure you have:
- Configured your thresholds and quality dimensions.
- Created an opportunity view that contains the rows for all the records being assessed in the report view above. i.e. total opportunities and named it using the convention tv*OptSel (e.g. tvAccount_AllRecords_OptSel).
Note: For further information on the creation of Opportunity Views see (Opportunity Views Best Practices section below).
Once these prerequisites are met, update the report following these steps:
- Navigate to Configuration - Report Repositories.
- Click the Reports button on the Data Source entry you wish to update.
- Click the Edit button on the report you wish to update.
- Update the following information in the vertical view of the Repository Reports page:
Report = <Can be left as currently registered>
Report Type = Error, Info or Metric (can be left as currently registered)
Implication = <Specify the implication if not present>
Comment = <Specify additional comments if needed>
Opportunity View = <Select the Opportunity view you created for the report>
Title = <Can be left as currently registered>
Quality Dimension = <Select the appropriate quality dimension>
Status = <Approved> or <Not Approved> depending on required status
Allow Manual Run = <Choose whether report can be manually executed>
Threshold ID = <Select threshold appropriate to the report>
For the other settings refer to the product documentation. - Click Save.
- Close the vertical view.
- Repeat steps 3 through 6 for any other reports you want to update in the specified Report Repository.
- For each report, click the respective Objects button and review the Objects that the report is related to.
Note: Multiple Objects can be associated if required. - Review the Groups that the object is published to and publish to any additional Groups that are required.
Opportunity View Best Practices
Opportunity views provide a list of all available records being evaluated for one or more specific reports. In practice this normally means that a single Opportunity view can be created that counts all available records in a specific data object table, for example, all active customers, where the deletion flag has not been set. This view can then be assigned to all reports that are evaluating the quality of the active customer data set.
Step to be considered when creating Opportunity views:
- Determine the data stores (tables or views) that contain the superset of every possible record that is being evaluated by the specific Error report.
- Determine if there is already an Opportunity view that contains this superset. If there is, reuse it.
- If not, create a view, named tv*OptSel on that data store
- Ensure that all primary key fields are included in the Opportunity view and any fields that are going to be used for user filters.
The recommended approach would be to build out Opportunity views for each of the data objects being evaluated first (i.e. Customer, Vendor, Employee, Materials, etc) so that report developers can use these base Opportunity views unless they wish further refine the Opportunity view specifically assigned to the Error report they are creating.
Upgraded Dashboards and Charts
After modifying your existing reports or registering new reports to include the opportunity views, and having processed your reports, the new dashboard will be populated. The Dashboard initially shows the summarized data quality scores for all processed reports (Overall) and by Quality Dimension in the top panel with the lower panel showing the score, no of reports, no of tables, no of columns, no of errors and a link to the history chart that make up the score above. By clicking on the dial in the top panel the focus for the lower panel will change to that of the specified quality dimension.

Screenshot 4: Monitor Dashboard - Overall focus
The user has the option to filter the dashboard to only include their reports using the toggle in the top right hand corner. By hovering over the name of the quality dimension the user can choose to focus the dashboard by Group, Object or Application, this creates an additional line of charts below the top level. On the additional charts the user can again hover over the name to display the option to refocus the dashboard on a specific Group, Object or Application.
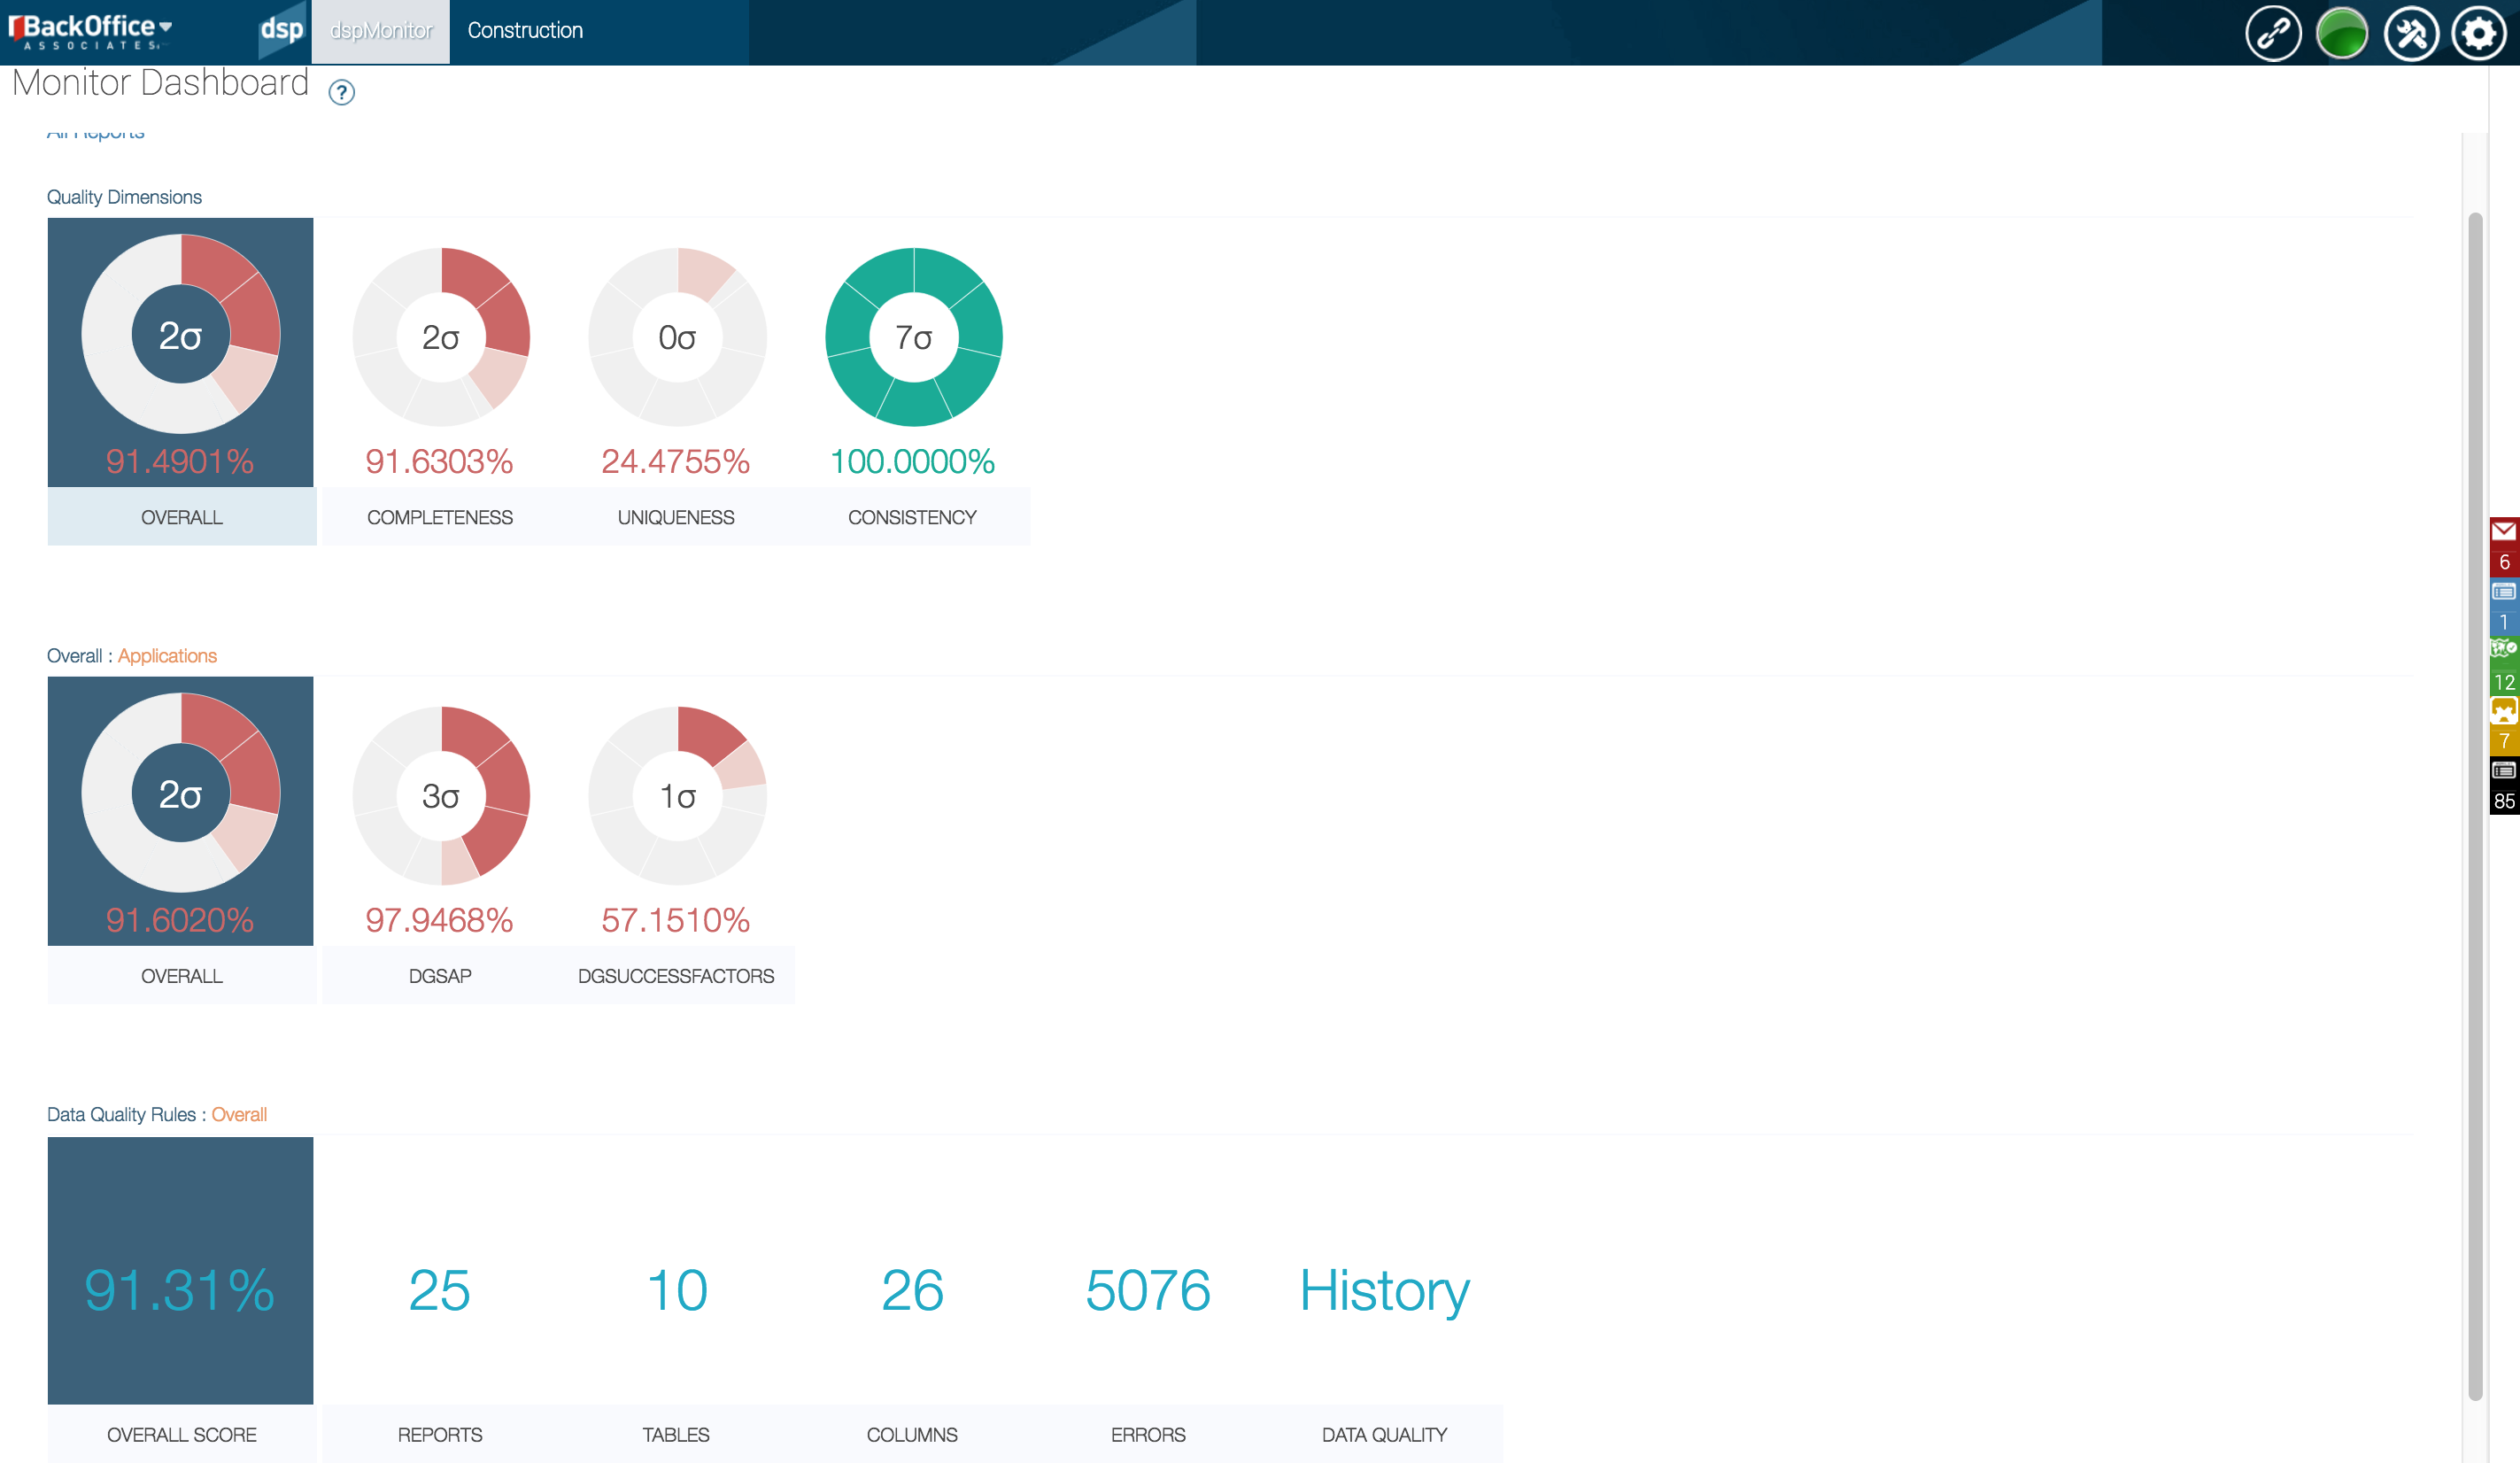
Screenshot 5: Monitor Dashboard - Applications focus
The bottom line of tiles allows the user to drill to the specific elements that the counts are relevant to, i.e. Reports tile will bring up a page of all the individual reports making up the count. The History tile will display the last 6 months of metrics captured, showing both the number of reports and the number of errors.