
Introduction
mSQL is able to produce a summary report on completion of certain stored processes. These reports can be output to a file using one of the several available formats (note that the ‘type’ attribute is used within XML configuration files to specify the reports’ format):
- PDF (Portable Document Format; type=pdf).
- RTF (Rich Text Format; type=rtf).
- Microsoft Excel (97-2003; type=xls).
- Microsoft Excel (97-2003; raw data only; type=xls2).
- HTML 3.2 (tables; type=html3).
- HTML 4.0 (type=html4).
- Crystal Report (type=rpt).
Additionally, report statistics are output to a new uniquely-named table within the data source.
Reports are produced for the following stored procedures. In most cases the collected data is either self-explanatory or uses standard 360Science terminology unless detailed below:
- GenerateKeys – Note excluded records can be identified if the first character of a mkDataFlags value is an ‘X’.
- BulkGenerateKeys - See GenerateKeys.
Note that you can use the setting outputSettings->reports in your configuration file to specify whether reports should be generated or not.
It is possible to incorporate a custom logo into the reports in place of the default mSQL logo that displays on the top right of the first page of each report. To do this, simply save your logo as “ReportLogo.jpg” and place it in the mSQL bin directory (which by default is C:\Program Files\mSQL\bin). Once in this location, the report creation process will automatically detect and use the custom logo you have provided. With regards to the dimensions of the logo, to match the size of the default mSQL logo you should create the logo on a canvas of 371px wide by 106px high.
As well as incorporating a custom logo into the report, it is also possible to include a website address and contact name (each of which appears in that order under the logo on the top right of the report). To do this, simply add a ‘contactWebsite’ and ‘contactName’ to the ‘reports’ node in the XML configuration file that is being called by the stored procedures (or the template being used in the case of SSIS). An example of this can be seen here. Note that the attribute names are case sensitive.
<reports enabled="true" path="C:\mSQL\reports" format="pdf" schema="reports" index="index" maxIndexEntries="1000" contactName="John Smith" contactWebsite="www.domain.com">
GenerateCorrectedAddresses Summary Report
The GenerateCorrectedAddresses Summary report is produced at the end of the GenerateCorrectedAddresses process and will look similar to the following screenshot.
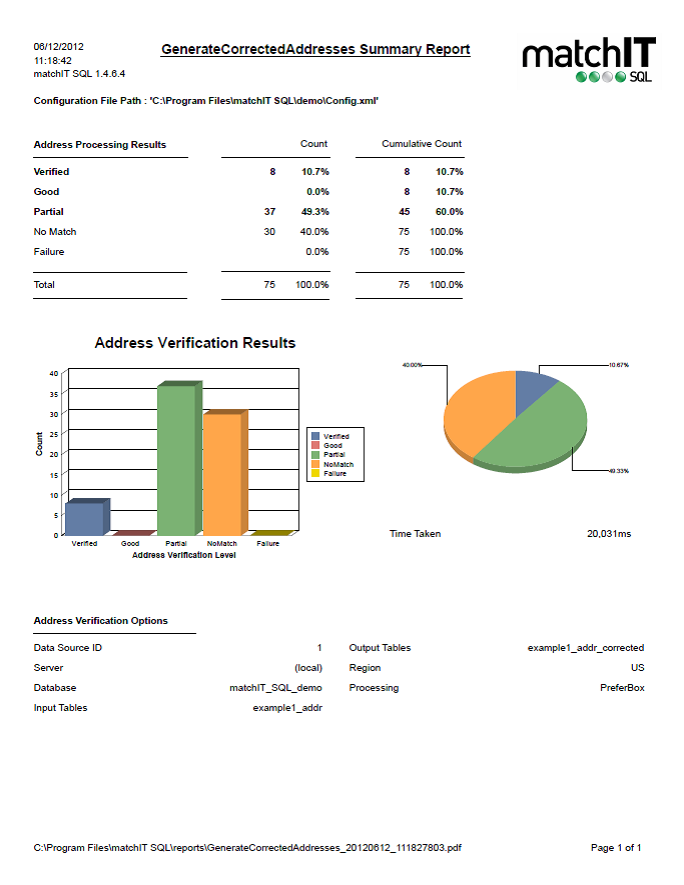
The report provides general figures reflecting the number of records falling into each verification level. These figures are also displayed in the form of a bar graph and a pie chart, to make general inspection easier to read and any problematic results easier to notice.
The FindMatches Summary report is produced at the end of the FindMatches process and will look similar to the following screenshot.
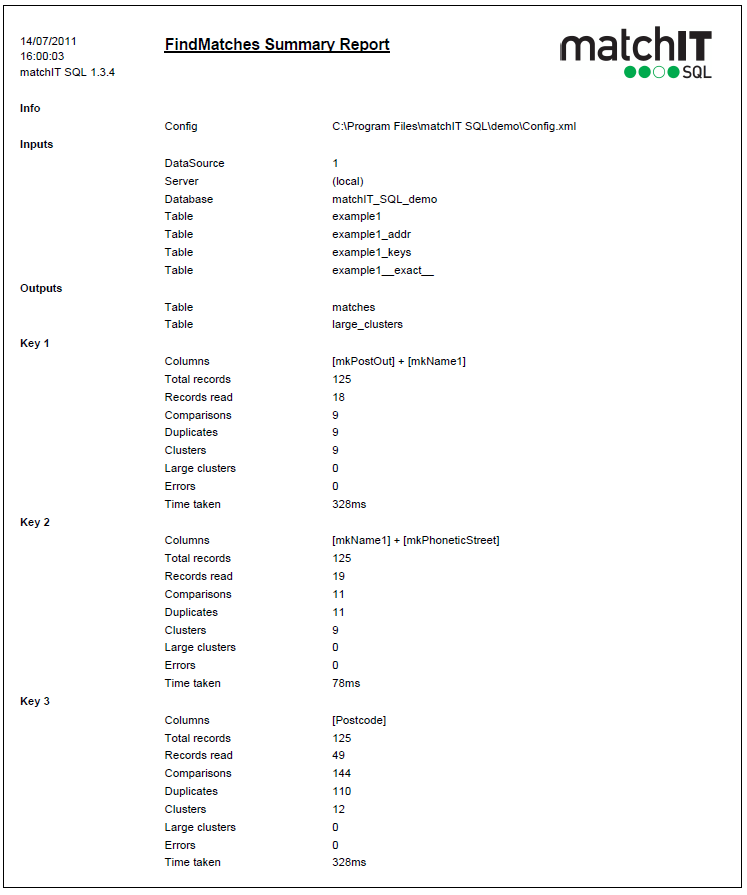
The FindMatches process produces the following information:
|
Reporting Category |
Description |
|
Total Records |
‘Total records’ refers to both the total number of records in the table, for each key, and the sum of these. |
|
Records Read |
‘Records read’ refers to the number of records that are considered for further comparison by the mAPI. If pre-clustering is enabled (the default) then this figure will usually be substantially lower than the total number of records in the table. |
|
Comparisons |
‘Comparisons’ refers to the number of record pairs that are compared by the mAPI. |
|
Duplicates |
‘Duplicates’ refers to both the number of duplicates found by a particular key and to the sum of these. |
|
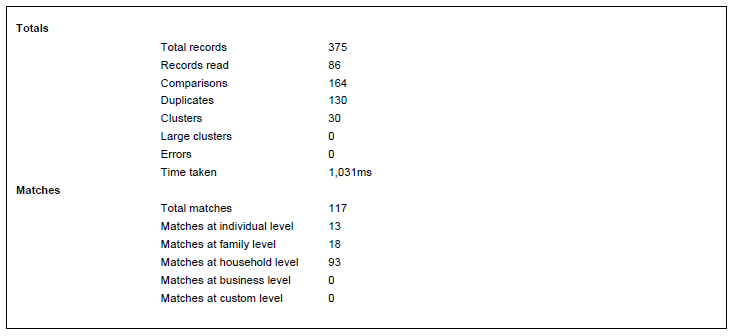
Matches |
‘Matches’ refers to a final number of unique duplicates (for example, one particular match might be found using two different keys, causing a duplicate count of 2 but a correct match count of just 1). |
|
Large clusters |
‘Large clusters’ refers to groups (clusters) of potential matches that are too big to be processed (i.e. the number of records exceeds the maximum cluster size). |
|
Errors |
‘Errors’ refers to processing errors within the mAPI; details of such records are logged (wherever possible, please forward these records to 360Science). |
See FindMatches.
This report is produced at the end of the GroupMatches process and will look similar to the following screenshot.
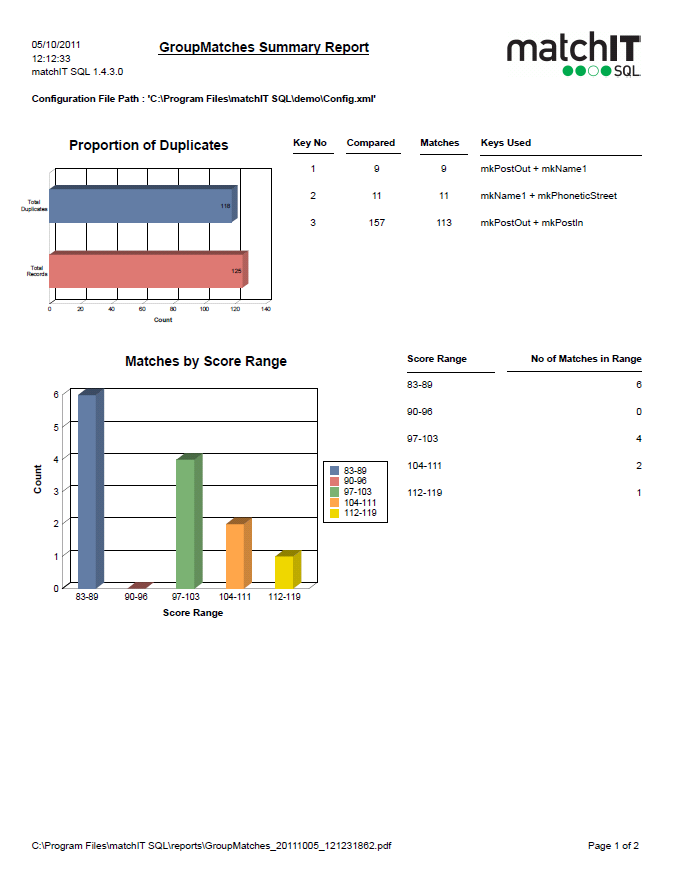
Notes:
- Proportion of Duplicates – indicates the percentage of records that mSQL has identified as being duplicated records.
- Matches by Score Range - indicates the number of matches in each scoring range, based on the minimum and maximum matching scores.
See GroupMatches.
FindExactMatches Summary Report
See FindMatches. Note, however, that records are not compared using the mAPI, two records are deemed exact matches simply if their composite key values are identical.
Notes:
- ‘Records skipped’ refers to records that have a blank composite key value; blank key components are indeed permitted, but they can’t all be blank. (For example, if the composite key is ‘mkNameKey+mkAddressKey+mkPostOut+mkPostIn’, then a record will be skipped if all of these keys are blank; two records will be considered an exact match if any key is not blank and their composite key values are identical.)
FindExactOverlap Summary Report
See FindExactMatches.
GroupExactMatches Summary Report
See GroupMatches.
Note, however, that there is no ‘scores’ section (exact matches are not given a score, they either exactly match or they don’t).
GroupExactOverlap Summary Report
See GroupExactMatches.